Lucy Hartley, Head of Service Strategy, Ownership and Performance, and Katie Dickerson, Senior Service Designer at TPXimpact agency, reflect on working together to map Defra group services.
In a previous blog post on transformation we spoke about testing a new approach to how we understand and map services. This will help us create a full picture of what our services are and how they all connect from our users’ perspective.
Creating this full view of our services is a starting point that will, over time, allow us to:
- identify opportunities to make our services more efficient and effective and ultimately, improve the experience of our users
- robustly test a new model of senior service ownership, and enable decision making at a whole service level
- make best use of shared technology, patterns and data to deliver greater impact and better value for money
- better understand and measure how our services have an impact on Defra’s ambitious environmental outcomes
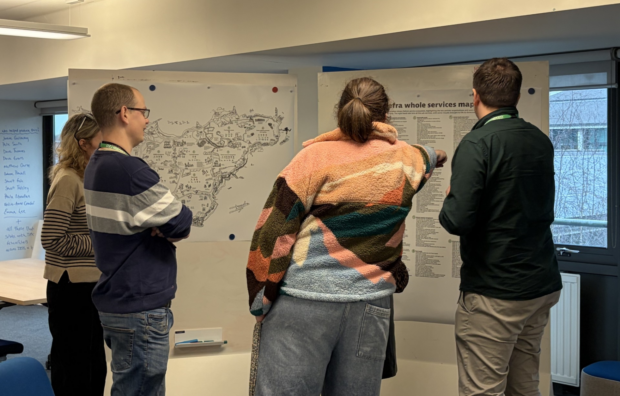
How we created a service landscape map
To create our first iteration of the service landscape, we worked with colleagues from our user-centred design capability partner TPXimpact to:
- understand whole services and map them across Defra group
- create a clear, effective narrative and visuals to help people understand and engage with the service landscape
As there were some time constraints to this first phase of work, we decided to make best use of existing data and relationships. We spoke to service teams from organisations across Defra group and analysed existing materials like team Mural boards, service lists, SharePoint sites and strategy documents. Where documentation or data did not exist, we did desk-based research, including reviewing guidance content and services on GOV.UK, to map some services.
Alongside this, we have been testing a narrative to explain the work and the opportunities and benefits of this transformation approach. We’ve been sharing our work through week notes and show and tells to ensure we’re working in the open. We’ve had valuable conversations about the purpose and potential benefits of understanding whole services, and how our colleagues’ work across Defra connects and aligns.
Taking different approaches
We mapped out our initial view of the service landscape. For each whole service, the map shows:
- example services
- example user behaviours and goals
- types of users
- organisations that are involved in delivering this whole service together
The information is also available in a spreadsheet that includes:
- which organisations and other government departments are involved in delivering the whole services
- what high-level goals the whole services help users meet
- what Defra outcomes and missions the whole services support
This is for anyone who needs an alternative format or for transformation teams who need more detail behind the whole services.
The map is supported by a high-level presentation and a discussion guide. This is to facilitate conversations about the service landscape across Defra, and how this view can help us to unlock true transformation and be able to meet our ambitious environmental outcomes.
As mentioned in our last blog post we created a service taxonomy prototype to test whether having a common language around services would enable more productive conversations about transformation and service optimisation. We have iterated our taxonomy to align to the refreshed Government Digital Service (GDS) definition of services and whole services.
We’re now working to understand groupings and services in terms of what users are trying to do and what Defra group is trying to have an impact on.
For example, the whole service ‘Flooding’ includes products and services that help users avoid and manage the impacts of flooding. These services also help Defra improve the nation’s resilience to the impacts of flooding and build resilient communities and economies.
Testing with users
Our most important next step was to validate the work further with external users. We needed to test that the whole services we identified accurately reflect common user needs and their language. We also reviewed existing user research and data to see what applicable insights we already had.
We showed different user groups, including members of the public, farmers and business users lists of ‘jobs-to-be-done’ that were relevant to them and asked them to group and name them. This helped us learn how they think about the tasks they do with Defra and how they describe them.
We also asked people about how long they have been interacting with Defra and how often they use our services, so we could see how their relationship to Defra impacts their mental model.
Following our research, we updated the whole services landscape map by:
- changing the names of some whole services to reflect the language users use
- merging some whole services
- moving some sub-services into different areas based on user groupings
We also identified some areas where we need to do more research due to inconsistencies in the ways that users grouped tasks.
Next steps
We will publish more updates as our journey continues. Thank you to everyone who took part in this work.
Leave a comment