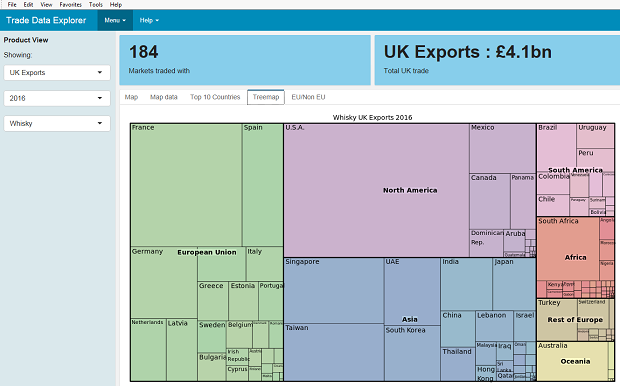
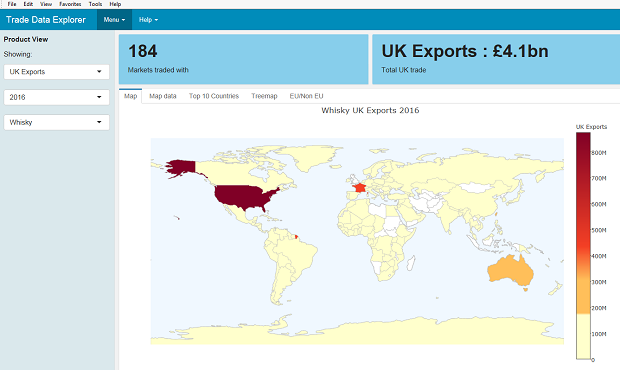
Last year I was lucky enough to get on to the GDS Data Science Accelerator. On this scheme participants offer their enthusiasm to learn data science and their time to work on a project of potential value to their departments. In return they get a shiny unlocked MacBook, a mentor to guide them, and the chance to work one day a week at a ‘hub’ (at the GDS headquarters in London or others around the country) and support each other as they develop their skills. My project was around analysing overseas trade data on food and drink – promoting exports is a big priority for Defra.
The Accelerator experience was brilliant – if you’re eligible, what are you waiting for? Apply! From a standing start, I learned loads. It reinvigorated me and opened my eyes to what is possible. Once I had ‘graduated’, I returned to my day job fired up to take my work forward and committed to using my new skills in other areas of my work.
However, I had to return that shiny MacBook and go back to my more restricted Defra laptop. Most of the open source software I’d used to build my project was unavailable to me. Of course corporate IT has to be secure, robust and resilient, we all understand that. But access to analytical software tools that are out-of-the-ordinary is still a source of frustration in many Whitehall departments.
I was lucky – trade data is mostly public and open, and I didn’t need to worry about the security of personal or sensitive data. So last Christmas I decided to start on my ‘guerrilla statistics’ project. I would develop my project using a Defra laptop, just not on a Defra platform. I really didn’t need a formal IT project.
I signed up for Amazon Web Services and figured out how to make a virtual server in the cloud. Then a cloud database. Then I figured out how to install R, RStudio server, Shiny server, and Nginx with a reverse proxy so that I could access them via Defra’s standard Internet Explorer install. I rebuilt my Accelerator project with a new focus – not data science this time, but a simple interactive visualisation of trade data.
Once I had that I was able to show it to a friendly face in our Data Programme. He generously allowed me to have access to Defra’s AWS account. Finally I could stop paying for this myself! I did it all again and ported it over.


So, finally, this is it: my trade data explorer. The idea was to make something which would allow policy and other customers to explore the data on their own. We get so many daily requests for, eg top 10 countries, top 10 markets, trade in (seemingly) random products like lettuce, that I think this would allow people to answer around 60% of them for themselves. But my customers can sometimes make incorrect conclusions from even simple datasets, so it had to be safe for them to use. Hence millions of records are aggregated into user-friendly categories.
If everyone reading this clicks on the link at once, it will overwhelm and break the server . It is not a finished product. It is slow, and there are a million trade visualisations out there which are more polished. It's fragile, and will disappear if I delete the server in AWS. But: it’s mine and I can do what I want with it. I can develop and adapt it to meet user needs. I built it without having to go through internal IT project processes. And the server costs Defra maybe £20 per month.
I did this under the radar – hence, it’s guerrilla statistics. Defra has a deserved reputation as a Whitehall leader in publishing open datasets, but we are definitely have some way to go in terms of analysis to get the most insight for policymakers. There is immense enthusiasm among statisticians in Defra to do things like this. However, others may not be able to follow my example because their data is sensitive or personal. The cloud is not necessarily for them.
But I hope I have helped to show one way forward. The more of us there are – making, sharing and learning without asking for permission but but hopefully gaining trust by doing the right thing – the more we will build our capacity, our community, our collective skills, and a policy customer base who expect these things and will lend their weight to ensure we can get wider and better access to these tools. My work is not a complete solution, but it does work. Show the thing, right?
2 comments
Comment by Elspeth Body posted on
Brilliant David, thanks for writing this post and showing your work - I'll be chatting to my team (Strategy and Implementation) to show this off. I wonder if we can parachute you in (guerrilla style, obviously) to other policy teams to share your knowledge and build similar things? Are you going to pitch a session at #DataMash?
Comment by David Lee posted on
Elspeth - I did a session about this at the GSS North Conference last month, and Mike Rose asked me to pitch for #DataMash, so I have. Not heard yet whether its been accepted. But I'm always happy to talk to people or teams direct in any case.