Defra deals in data. And lots of it. A big part of the department’s job is to collect, process and, through careful service design, convert data into something useful for citizens, businesses and other agencies.
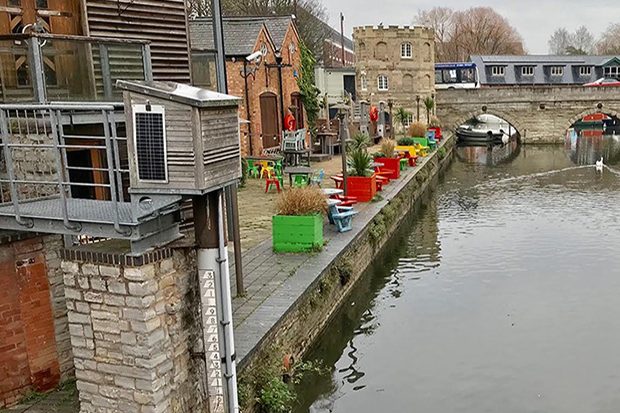
Contributing to this data pile is the Environment Agency’s network of 5,500 telemetry outstations. These range from simple gauging devices that measure river levels (see image above), to complex control structures and pumping stations that monitor hundreds of variables.
We’ve successfully integrated river level data into the flood information service. But doing so generated even greater demand, plus users have made it clear they’ve a huge appetite for much more frequent updates – a costly add-on that wasn’t viable unless a smarter telemetry solution could be found. Happily, some resourceful teams in the Environment Agency have risen to the challenge.
Why telemetry datasets are useful
All collected data has value, but the real magic happens when several sets are combined. When fed into flood warning and forecasting systems, these can become formidable flood indicators.
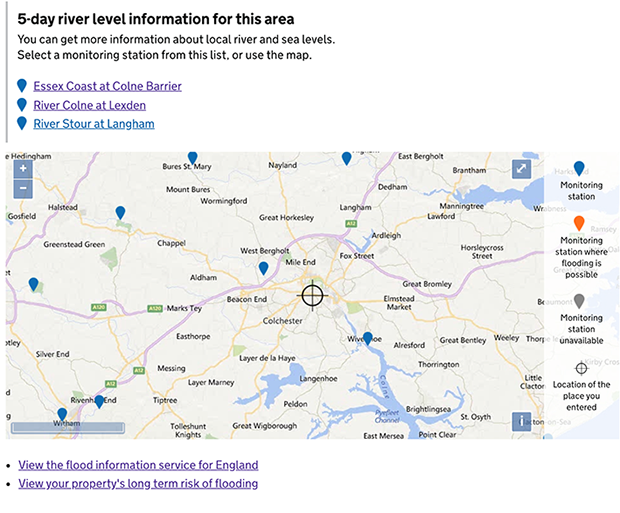
Data drives our river and sea levels in England service and help us and our users make informed decisions about potential flooding. They’re also used by duty officers to issue flood alerts and flood warnings to the public via our flood warning service.
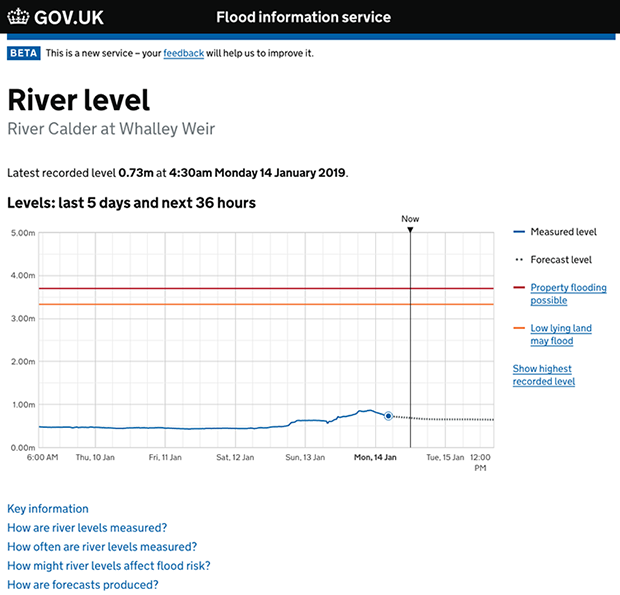
Our users like river levels. 3 years of feedback strongly indicates that many users visit their nearest river level gauging station page routinely during poor weather (see image above). More engaged users, with good knowledge of local topography and river behaviour, check levels at upstream stations in order to work out what’s coming towards them.
There’s a dedicated page for some 4,000 river and coastal gauges on our service. These pages help users understand their flood risk now and in the next few days. We also use data models based on local conditions and Met Office rainfall predictions to forecast river levels (see image above). Because these forecasts are linked to the weather they can change quickly, so we update them more frequently if the risk of flooding increases.
How we gather river level data
Some gauging stations are located in remote or challenging areas. Phone line or broadband infrastructure may not exist, while access to mobile networks may be patchy, at best. The data is also raw and transmitted automatically, so there’s limited opportunity for verification and quality assurance.
We communicate with most outstations using either a physical phone line (known as circuit switch PSTN) or 2G cellular communications. During normal conditions, measurements and other data are collected automatically (or ‘polled’) once or twice a day and the data transmitted back to our systems as telemetry.
They’re polled more frequently, typically every 15 minutes, when a high level threshold has been crossed in that catchment and a flood event becomes more likely. We don’t permanently poll outstations every 15 minutes due to prohibitively high calls costs and battery drain. This near real-time data update mode is known as enhanced polling.
Once a flood threat passes, we resume normal polling frequency. Measuring equipment is monitored continuously for faults to make sure the network stays online. Sometimes polling is delayed due to maintenance, system outages or telemetry failure.
Responding to feedback and saving money
As our flood information services have evolved and become more useful to more people, we’ve continued to scrutinise their needs through user research. One of the most common feedback themes is that water level data becomes much more useful when network updates are delivered to the online service more frequently, ideally in real time, and aggregated with other datasets. This helps give users a real-time feel for what’s going on, and enables them to respond appropriately.
Responding to this challenge, our colleagues on the Future of National Telemetry (FoNT) project are upgrading our data communications infrastructure. A new platform will allow cellular network IP communications between our telemetry systems and the outstation network, meaning:
- overall system costs will be greatly reduced
- every site can be polled every 15 minutes
The SIM cards we use at our outstations will be able to pick up and use the strongest signal they can find from any of the four mobile phone networks. We believe this will improve the reliability and quality of the data piped into our telemetry systems.
Planning for infrastructure changes are expected to get underway during the first half of 2019, with the roll out of on-site upgrades starting shortly after. The long-term programme means users will see a gradual but positive shift, across multiple services, towards close-to-real-time data updates and all the benefits they bring.
To contact us about our work, please email floodresearch@environment-agency.gov.uk
Find updates and follow our progress on Twitter @Flooddigitalea and Defra Digital blogs.
Thanks to Faye Burrows, Product Manager, Flood Information Service, and Sam Everitt and Lee Jones, Senior Technical Advisors at the Environment Agency, for their help with this blog.
2 comments
Comment by Dave Gunderson posted on
It's wonderful when you get a telemetry upgrade. I've gone through the process within my own system. When I started as a 'Telemetry Tech' some 26 years ago, we used Bell 202 MODEMS over Line of Sight LOS Radios. Data Collection was at Real Time at hourly intervals. Today the collection happens on a minute to minute basis and is IP based.
When asked what I've learned over the years about field data collection is that the weak points are reliable site power and field telemetry. Of telemetry in general, it's ALL about bandwidth, data loads being passed and time management of the polling. The interesting fact is that our collected data minimums are always becoming larger due to the fact of the end customer wanting higher time series data resolution and metadata from the site (in addition to the baseline data). Once I provided the additional data they requested, they wanted more.
There are methods to enhance the telemetry load through a low bandwidth system. However you have to be inventive in the methods and also be handy in software development. Transitioning to IP based communications helped. The other critical component was using the correct data logging equipment at the sites.
I wish you well in the design and upgrade in your own system.
Dave https://www.linkedin.com/in/dwgunderson
Comment by Michael Lyons posted on
Thank you for your comments, Dave. Happily, advances in technology are now helping us improve the speed and frequency of our telemetry so we can better convert it into useful, usable public services. Look out for further updates on this blog as we update on our progress.